What is a time-series forecast?
A time-series forecast predicts the next most likely value (or values) in a given data set. An example would be predicting the future price of a stock. Forecasting relies on using past trends to predict future outcomes.
5 Common uses for forecasting
Predicting future stock and cryptocurrency prices
There are over 2 billion trades made every day on the new york stock exchange. Many professional traders use a combination of forecasting methods to predict future prices. Learning the basics can bring you one step closer to trading with the best of them.
Creating financial forecasts
How much money will our business make next year? This is a question that is not always easy to answer but has big implications. A bad financial forecast can put a company in serious financial trouble.
Weather forecasting
Behind the 7’clock weather report is a team of scientists who are experts in forecasting. They use complex models to predict whether you’ll be going to the beach this weekend.
Utility Companies
Electricity demand varies by region, time of day, and time of year. Since it is hard to store, there needs to be accurate forecasting to reduce waste.
Supply chain management
We’ve all been there. Our size t-shirt is out of stock at our favorite store. The last thing a company wants is to not have the supply to meet customer demand. Often raw materials orders need to be weeks to months in advance. This requires precise forecasting.
The 2 Easiest Ways to Forecast in Sheets
There are 2 built-in forecasting functions built into Google Sheets. Each function provides general trend forecasting for a particular scenario.
Using the FORECAST function
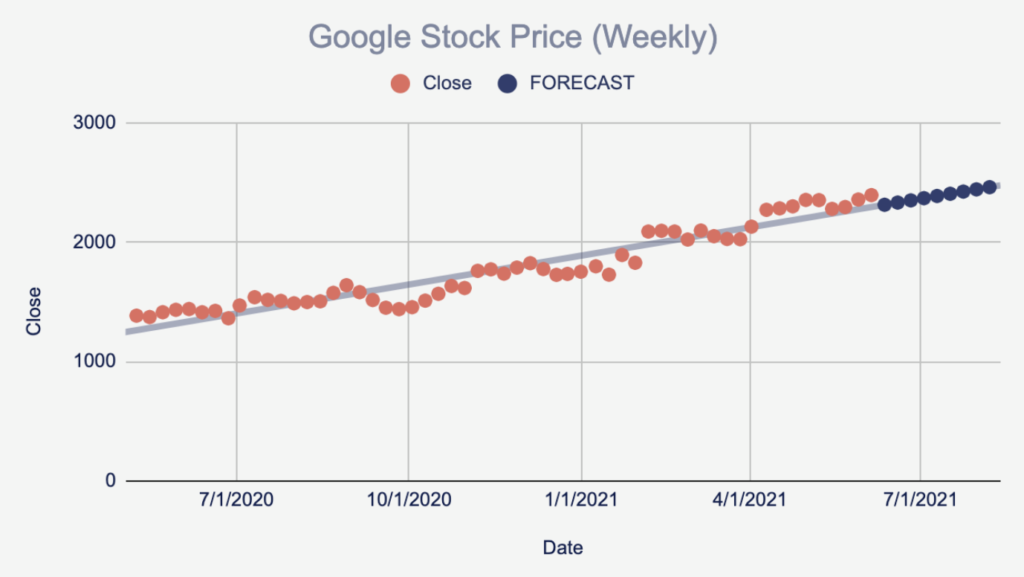
This function draws a linear regression trend line for a dataset. A linear regression line does not necessarily try to predict future data points. Instead, it tries to predict the direction that the data points are moving. This forecasting method assumes that your dataset is generally linear.
Format
=FORECAST(x, data_y, data_x)
Example
=FORECAST(Future Date, Historical Stock Prices, Historical Dates)
Using the GROWTH Function
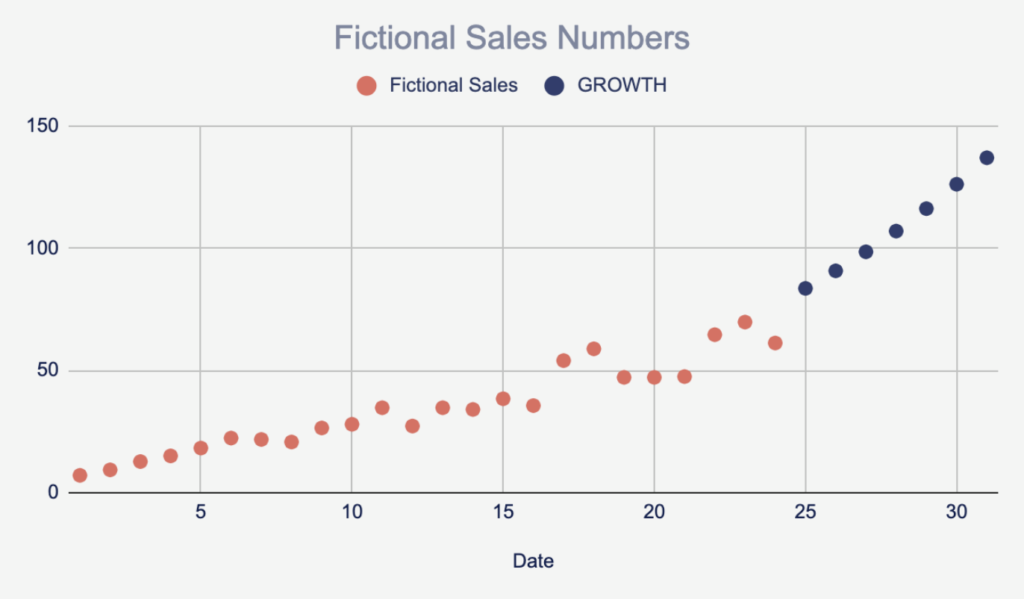
The growth function, like the FORECAST function, predicts the direction of a dataset. The difference is that this function assumes exponential growth.
Format
=GROWTH(B2:B10,A2:A10,A11:A13)
Example
=GROWTH(Historical Sales, Historical Dates, Future Dates)
How to Do a Monte Carlo Simulation in Sheets
What is a Monte Carlo Simulation
A Monte Carlo simulation uses historical data to simulate possible future scenarios. Then you can sample outcomes to statistically predict the likelihood of different outcomes. While this is an advanced topic, we can cover the basics of running simulations in Sheets.
Step #1 – Create Stats on Percent Change
To prepare your dataset for simulations, you need to first create a percent change column. Once you have done that take the following stats from the change column:
- Average
- Standard Deviation
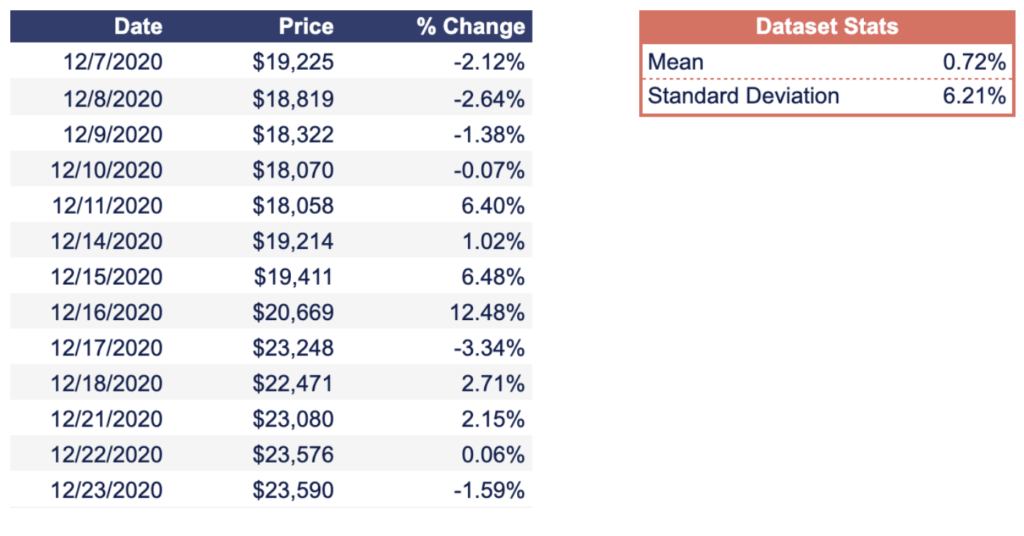
This is accomplished with the functions: AVERAGE (to calculate mean) & STDEV.P (to calculate standard deviation).
Step #2 – Run The First Simulation
Simulations are comprised of two parts. The first is an initial random value generated with the NORMINV function. The second is another random value multiplied by the first. This effectively simulates one of many possible scenarios.

Step #3 – Run A LOT of Simulations
To get the most accurate data back from the Monte Carlo method, you must run hundreds or thousands of simulations. This provides enough data to construct a full histogram of outcomes.
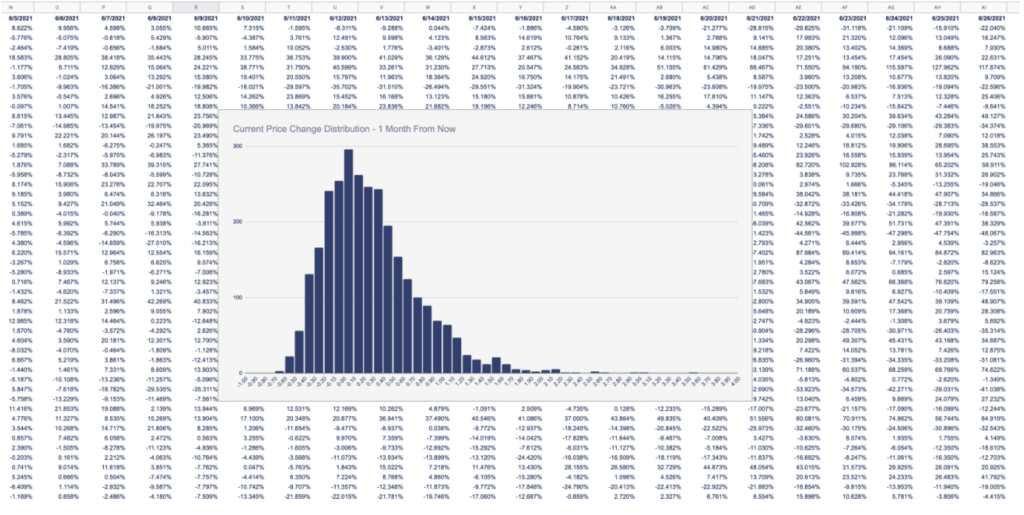
Once you have a sufficient number of simulations, all that’s left is a little bit of charting. Highlight the final day column and create a histogram. This will show you all the simulated outcomes, and how often each occurred. From that, you can determine the likelihood of ending up with a value above or below any point.
Monte Carlo Stock Forecaster Template
This template is for educational purposes only and is not meant to give financial advice.
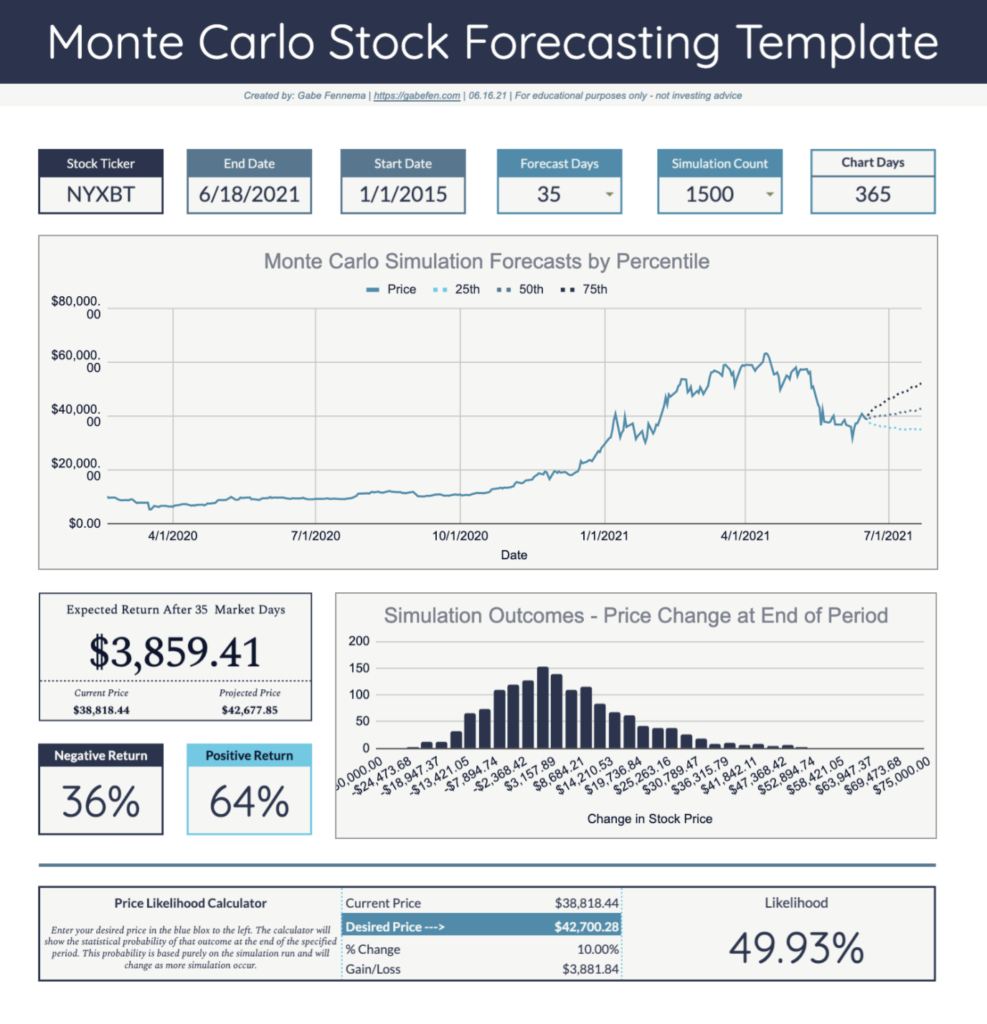
How to use this template
This template shows how one might use Monte Carlo simulations to predict the risk related to stock. The 6 parameter boxes at the top of the sheet are all alterable. I will warn you, that the more simulations that are running, the longer it will take. I have capped the total simulation number at 2000.
The other alterable field is at the bottom of the sheet labeled “Desired Price.” If you put the desired price in this field it will calculate the probability of exceeding this price by the end of the forecasting period.
3 Tricks to Automate Spreadsheet Forecasting
Automating Stock Forecasting
If your forecasting goal is at all related to the stock market, this function is a lifesaver. The =GOOGLEFINANCE function will give you entire stock histories for any ticker. The best part? The function will automatically pull in new data every 20 minutes. This makes Google Sheets a great tool for keeping an eye on your portfolio. Additionally, the historical data makes it an incredible function for forecast model tuning.
The only downside to this function is the exclusion of cryptocurrency. I have found a workaround for Bitcoin (“NYXBT”) which a bitcoin index. If you want to track other cryptocurrencies I would recommend installing an addon.
Automating Website Forecasting
Earlier this year I was looking at a software product that would charge per website visit. If I had decided to buy it, I would have needed to start closely forecasting website traffic. The best tool that lets you automate this for free is Google Analytics.
The GA Sheets plugin is one of its most underrated features. Google will automatically update and import all your website data to a sheet of your choice. All this historical data is easy to plug into a forecasting model. Whether it is traffic or goal conversion, you can easily forecast every part of your funnel.
Automating Sales Forecasting
One of the most common uses of forecasting is to predict sales. Love them or hate them, most companies use Salesforce to track sales. Thankfully, Google built a free Salesforce data connector. This may be the only free Salesforce-related product I’ve ever heard of.
The beauty of this connector is that it provides scheduling capabilities. It also has some serious power behind it with SOQL capabilities. Regardless of which data you want to export, this addon will help you do it.

